How to Read Museum Attendance After Capital Renovations
A major entrance upgrade or wing reopening can raise visitor counts without fixing structural demand. This guide shows how to separate short term rebound from durable audience recovery.
When a museum reopens a major wing, entrance, or circulation system, headlines usually celebrate improved visitor numbers. That headline can be true and still misleading. A capital upgrade can increase throughput, reduce queue friction, and create launch momentum without proving that long horizon demand has recovered. If you manage collections, funding, or programming strategy, the distinction is critical.
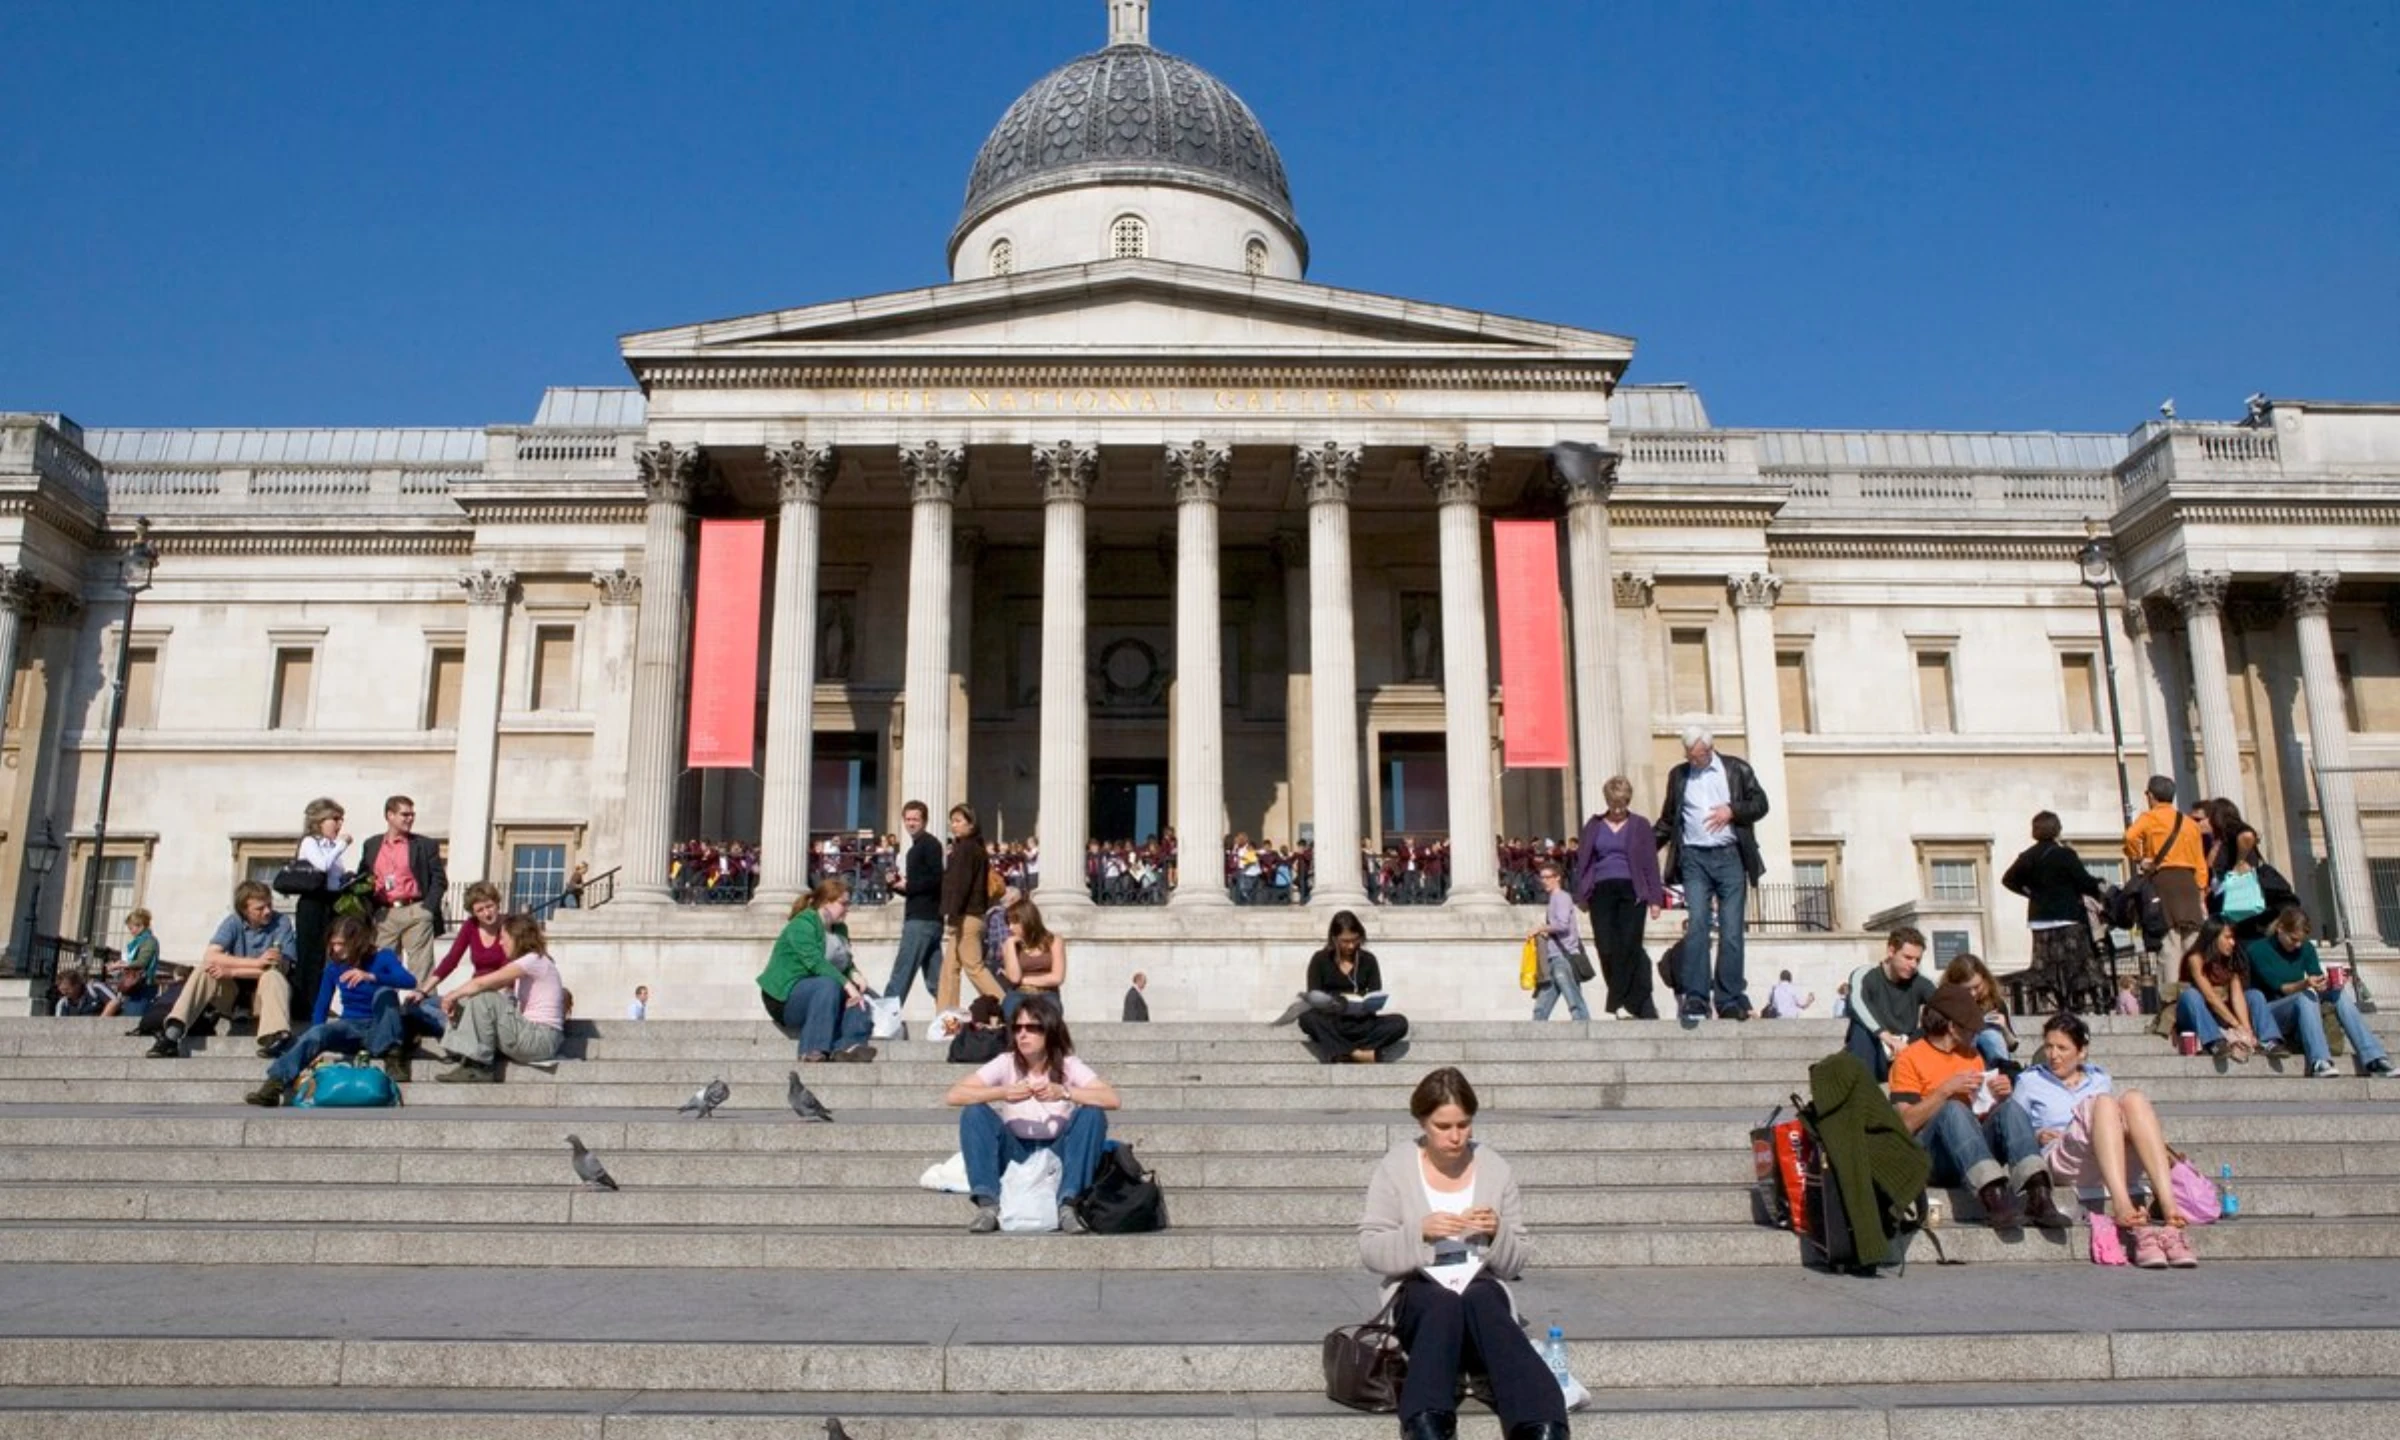
The National Gallery in London offers a useful case. Attendance rose sharply in 2025 after the Sainsbury Wing reopening, yet annual totals remained below pre-pandemic benchmarks according to The Art Newspaper's survey. The lesson is simple: operational improvements can lift performance while the institution still carries structural audience deficits, especially in international tourism segments.
First, separate gross attendance from baseline trajectory. Ask whether current numbers are above the immediate prior year, above five year trend, and above pre-shock benchmark. A rise versus last year can coexist with a persistent medium term gap. Board level reporting often overweights the first comparison because it tells a cleaner success story.
Second, measure visitor mix, not only volume. International declines can be partially hidden by local gains, and vice versa. If your pre-crisis model depended heavily on long haul tourism, domestic substitution may stabilize ticketing but alter secondary revenue patterns such as memberships, retail, and premium events. Segment level recovery is usually more important than aggregate recovery.
Third, test whether physical upgrades changed dwell quality or just entry speed. Better entrances and security flow can move more bodies through the door, but mission outcomes depend on time spent with collections, return visit frequency, and program conversion. Museums should pair attendance dashboards with gallery dwell studies and post visit surveys, then publish findings transparently.
Fourth, watch staffing and deficit signals immediately after reopening. If attendance rises while staffing cuts are announced, that indicates financial pressure is still unresolved. In those conditions, institutions risk extracting short term gains from renewed public attention while reducing the operational capacity needed to sustain service quality.
Fifth, benchmark peer institutions with different demand drivers. London data shows highly uneven performance across major museums. Comparing one art museum to one science museum can mislead unless you normalize for audience profile, family traffic, school visit patterns, and tourism dependency. Better benchmarking aligns institutions by demand structure, not only by size.
Sixth, map policy and macro factors that renovation cannot fix. Brexit related travel patterns, airline pricing, visa friction, and city level cost of living all affect museum footfall. Capital projects can remove institutional barriers, but they cannot independently offset broad mobility shifts. Strategy must acknowledge external constraints or forecasts will drift into optimism bias.
Seventh, evaluate whether expanded narratives are matched by programming investment. Institutions often justify new capital phases by promising broader and more contemporary storytelling. That promise only materializes if curatorial hiring, interpretation budgets, and education staffing follow. Without those commitments, physical renewal risks becoming aesthetic modernization without audience transformation.
Eighth, use monthly cohorts to identify decay after reopening novelty. Launch periods often produce an initial surge from media attention and local curiosity. The stronger signal appears six to twelve months later, when novelty fades and repeat behavior either stabilizes or collapses. Cohort analysis helps leadership avoid mistaking launch energy for durable demand.
Ninth, track regional ecosystem effects. New openings nearby can either cannibalize traffic or expand destination momentum for a city. London's broader museum landscape, including shifts at large institutions and new venues, shows that audiences distribute differently when cultural supply changes. Single institution analysis misses this network effect.
Tenth, read communications language closely. Phrases like in line with expectations may indicate realistic planning, or they may mask lowered targets set after underperformance became visible. Analysts should request target history, not just current target attainment, to see whether success criteria were revised mid cycle.
Eleventh, connect attendance interpretation to governance decisions. Capital projects often lock institutions into future operating costs, debt service, and maintenance commitments. If post project demand remains structurally lower than pre-crisis levels, boards may need to rebalance program ambition and cost discipline rather than expecting a full automatic rebound.
Twelfth, maintain scenario planning discipline. Build at least three cases: gradual recovery, plateau below historical peak, and renewed softening from macro shocks. Tie each case to staffing thresholds, exhibition pacing, and fundraising strategy. Institutions that do this early preserve agency when data turns against headline narratives.
Thirteenth, avoid one metric governance. Attendance is visible and politically useful, but institutional health also includes collection care, scholarly output, labor stability, school engagement, and donor concentration risk. A museum can improve attendance while weakening in less visible dimensions that matter for long term mission integrity.
Fourteenth, publish methodology with your numbers. Trust increases when institutions explain what is counted, over what period, and with what exclusions. Transparent definitions reduce suspicion, improve peer comparison quality, and keep boards focused on evidence rather than celebration cycles.
Fifteenth, treat post renovation years as a strategic reset window, not a victory lap. The most effective institutions use this period to redesign audience development, update interpretation frameworks, and align staffing with actual demand patterns. The headline question is not whether attendance bounced. It is whether the institution adapted to the world that exists now.
Institution references for benchmarking and policy context: the <a href='https://www.nationalgallery.org.uk/' target='_blank' rel='noopener'>National Gallery, the <a href='https://www.tate.org.uk/' target='_blank' rel='noopener'>Tate, the <a href='https://www.nhm.ac.uk/' target='_blank' rel='noopener'>Natural History Museum, and the <a href='https://www.vam.ac.uk/' target='_blank' rel='noopener'>Victoria and Albert Museum.